Techniques for measuring abiotic factors
Non-living factors can be measured through data loggers, expensive chemical testing equipment, simple thermometers and observations.
In this webpage, we will discuss the techniques we will use at the wetlands during our Field Observation as well as the tools used by environmental scientists at the same site to record the data for the Waterwatch website: www.vic.waterwatch.org.au/site/2000606
The tests that we will do at the Wetlands are:
- Temperature (Air)
- Temperature (Water)
- Turbidity
- Dissolved Oxygen
- pH
- Electrical Conductivity
- Ortho phosphorous (Phosphate levels)
- Nitrates
Temperature
Temperature of the air and water can be measured very simply with a thermometer. This is a good estimation of the temperature as there will be various results provided by different readers, depending on the accuracy of their reading scales and the angle they look at.
Results can also be gained with a digital thermometer or data logger. We will use this digital tool and compare it against the results we gain from multiple readings of the thermometer. Your goal is to determine, which tool gives the most accurate results.
Why is temperature important?
Water temperature affects the amount of dissolved oxygen, the rate of photosynthesis by plants and the sensitivity of aquatic animals to toxic wastes and disease. When the water temperature is lower, the amount of Dissolved Oxygen is generally higher, because oxygen dissolves more easily in cold water than warm water.
Task 1
Think-Pair-Share
What could cause the water temperature to (a) increase and (b) decrease?
Turbidity
Turbidity measures how clear or muddy the water is and affects the amount of light able to pass through it. Suspended particles from erosion or sewage can cause high turbidity levels and can also absorb heat. When the water is cloudy, less light can reach plants and animals living in the freshwater. This slows photosynthesis rates and reduces the amount of oxygen available in the water for animals, like fish and invertebrates, to use.
Turbidity is measured in nephelometric turbidity units (NTU), a reading of 0-10 is considered normal. Greater than 10 is considered high.
How to make your own turbidity tube:
Comprehensive instructions and theory: www.virginia.edu/blandy/blandy_web/education/Bay/TurbidityTubeConstruction&Use_Myre_Shaw.pdf
More basic guide:
content.teachengineering.org/content/cub_/activities/cub_waterqtnew/cub_waterqtnew_lesson01_activity1_howtomake_tube_jly_tedl.pdf
Using a Turbidity Tube Before You Begin:
• Be sure to use a clean bucket or other container to collect water samples
• Measurements should be taken in daylight, but not direct sunlight. Cast a shadow on the tube by placing yourself between the sun and the tube.
• Do not wear sunglasses when reading the tube.
• If possible, work with a partner to help verify measurements and disk visibility.
When Measuring, Remember:
• Highly colored water will register as having a higher turbidity than it actually does.
• The turbidity scale is logarithmic, so it cannot be linearly interpolated.
Measuring Procedure:
1. Dip the container into the water. Be careful not to include sediment from the bottom of the body of water.
2. Rinse the tube with the water that is going to be tested and pour it out.
3. Stir or swirl the water sample in the container vigorously until it is homogenous, introducing as little air as possible.
4. Place your head 10 to 20 centimeters directly over the tube so that you can see the viewing disk while the sample is being poured into the tube. 5. Slowly pour water into the tube. Try not to form bubbles as you pour. If bubbles do form: Stop pouring and allow any bubbles to rise and the surface of the water to become still.
6. Keep slowly adding water until the pattern on the disc becomes hard to see.
7. Watch the viewing disk closely and add water even more slowly. Stop pouring as soon as the pattern on the disk can no longer be seen. If you can still see the viewing disk pattern when the tube is full: Record the turbidity value as less than the final measuring mark. (Example: If your tube is full and your highest mark is 5 NTU, write down that the turbidity is “<5 NTU”.)
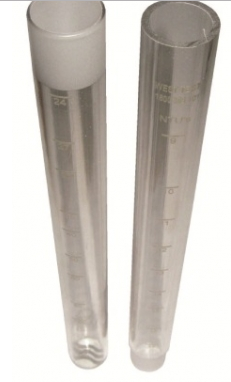
8. Read the turbidity from the scale on the side of the tube.
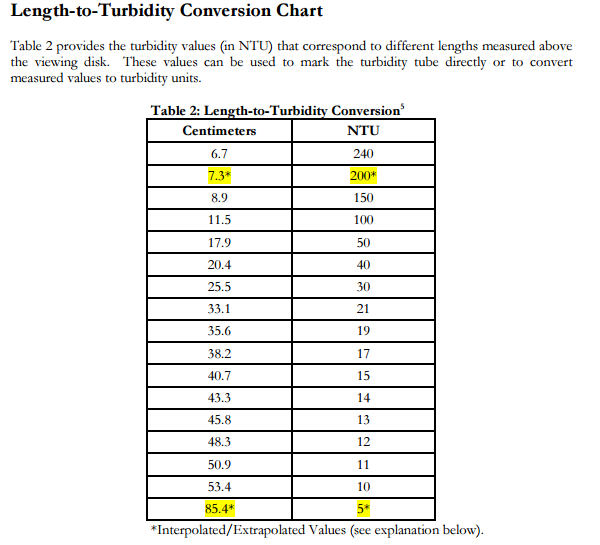
Remember: If your turbidity tube does not have turbidity values marked on the tube side, simply measure the water level with a ruler or tape measure and find the corresponding turbidity value in Table 2
Task 2
Your teacher has some samples of water from various locations on various days. Make sure you swirl the water to mix it as the particles may have settled.
Use the turbidity tube to test the water your group has been given. Make sure everyone in your group has a go.
Consider the following questions:
Turbidity is measured in nephelometric turbidity units (NTU), a reading of 0-10 is considered normal. Greater than 10 is considered high.
How to make your own turbidity tube:
Comprehensive instructions and theory: www.virginia.edu/blandy/blandy_web/education/Bay/TurbidityTubeConstruction&Use_Myre_Shaw.pdf
More basic guide:
content.teachengineering.org/content/cub_/activities/cub_waterqtnew/cub_waterqtnew_lesson01_activity1_howtomake_tube_jly_tedl.pdf
Using a Turbidity Tube Before You Begin:
• Be sure to use a clean bucket or other container to collect water samples
• Measurements should be taken in daylight, but not direct sunlight. Cast a shadow on the tube by placing yourself between the sun and the tube.
• Do not wear sunglasses when reading the tube.
• If possible, work with a partner to help verify measurements and disk visibility.
When Measuring, Remember:
• Highly colored water will register as having a higher turbidity than it actually does.
• The turbidity scale is logarithmic, so it cannot be linearly interpolated.
Measuring Procedure:
1. Dip the container into the water. Be careful not to include sediment from the bottom of the body of water.
2. Rinse the tube with the water that is going to be tested and pour it out.
3. Stir or swirl the water sample in the container vigorously until it is homogenous, introducing as little air as possible.
4. Place your head 10 to 20 centimeters directly over the tube so that you can see the viewing disk while the sample is being poured into the tube. 5. Slowly pour water into the tube. Try not to form bubbles as you pour. If bubbles do form: Stop pouring and allow any bubbles to rise and the surface of the water to become still.
6. Keep slowly adding water until the pattern on the disc becomes hard to see.
7. Watch the viewing disk closely and add water even more slowly. Stop pouring as soon as the pattern on the disk can no longer be seen. If you can still see the viewing disk pattern when the tube is full: Record the turbidity value as less than the final measuring mark. (Example: If your tube is full and your highest mark is 5 NTU, write down that the turbidity is “<5 NTU”.)
8. Read the turbidity from the scale on the side of the tube.
Remember: If your turbidity tube does not have turbidity values marked on the tube side, simply measure the water level with a ruler or tape measure and find the corresponding turbidity value in Table 2
Task 2
Your teacher has some samples of water from various locations on various days. Make sure you swirl the water to mix it as the particles may have settled.
Use the turbidity tube to test the water your group has been given. Make sure everyone in your group has a go.
Consider the following questions:
- What issues did you find with with this technique? Did you all get the same results?
- How could you make your group's results more accurate?
- If you were to explain this technique to a student who was away today, but was going to be in your group on testing day, how would you explain this technique to them so that their results are as accurate as possible. You may use a written recount, a flow chart or visual representation of the steps.
- As a class, order your samples from healthiest to unhealthiest. How did you come to make this decision together? Do the samples look like they match their ranking? Why might observation alone not be enough?


Dissolved Oxygen (DO)
The amount of oxygen available for plants and animals living in the water is very important for their survival.
A higher DO level indicates better water quality and is affected by photosynthesis and flowing water. Cold water holds more oxygen than warm water.
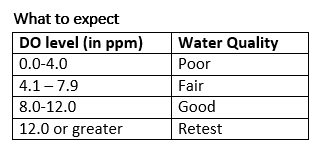
DO levels can vary between 0-18 ppm (parts per million). A level of 5-6 ppm is required for biodiversity.
Dissolved oxygen can be tested with a biochemical test or a digital probe. We will use a biochemical test for this test.
A higher DO level indicates better water quality and is affected by photosynthesis and flowing water. Cold water holds more oxygen than warm water.
DO levels can vary between 0-18 ppm (parts per million). A level of 5-6 ppm is required for biodiversity.
Dissolved oxygen can be tested with a biochemical test or a digital probe. We will use a biochemical test for this test.
Task 3
Use the DO Biochemical Test to measure the Dissolved Oxygen of the water sample you were provided.
Dissolved Oxygen (Modified Winkler Method)Safety: Wear gloves and Safety Glasses
Materials
Tube A
Used specimens can be flushed with tap water down the drain to the sewage treatment plant.
What does this test tell you about the water quality of the sample you have tested?
As a class, rethink the order of the samples you have been testing based on this new data.
Use the DO Biochemical Test to measure the Dissolved Oxygen of the water sample you were provided.
Dissolved Oxygen (Modified Winkler Method)Safety: Wear gloves and Safety Glasses
Materials
- O2-1 –Manganese chloride 25-83%
- O2-2 – Sodium hydroxide 20-25%
- O2-3 – Sulfuric acid 80-98% and 4-hydroxy-1,3phenylenediammonium dichloride
- 2 screw plug measuring glasses
- 1 slide comparator
- 1 colour chart
- 1 plastic syringe 1mL
Tube A
- Add 1mL of the water sample in Tube A
- Place the tube in the slide comparator in position A
- Rinse the glass oxygen reaction bottle several times with the water being tested
- Fill the glass oxygen reaction bottle with the water until it overflows without air bubbles
- Add 5 drops of O2-1
- Add 5 drops of O2-2 and close the bottle with the stopper (avoid air bubbles) and mix by shaking for 1 minute
- Add 12 drops of O2-3 close the bottle and shake well until the deposit is dissolved
- Pour 1mL of this water solution into Tube B
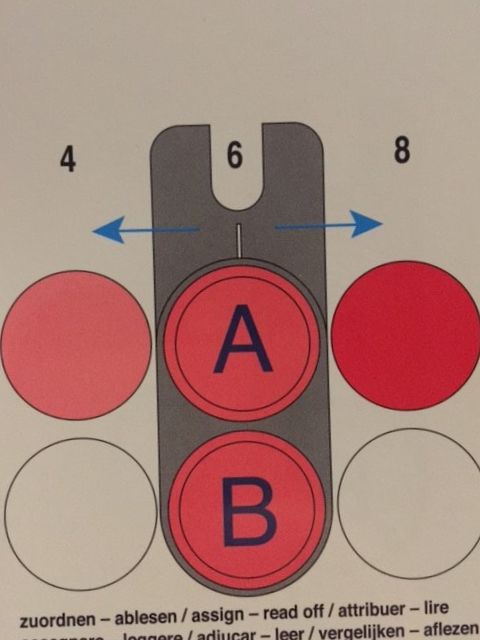
- Place Tube B into position B of the slide comparator
- Slide the comparator across the colour chart until dots appear the same colour
- Record the number above the dots
Used specimens can be flushed with tap water down the drain to the sewage treatment plant.
What does this test tell you about the water quality of the sample you have tested?
As a class, rethink the order of the samples you have been testing based on this new data.
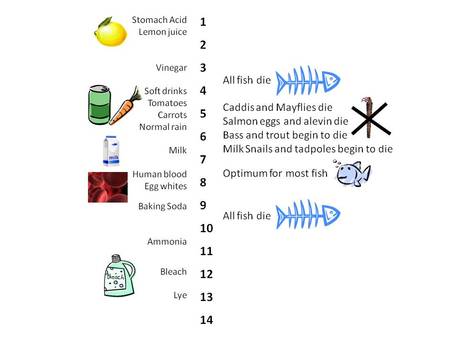
pH levels
http://extension.usu.edu/waterquality/whats-in-your-water/ph
|
All organisms have different pH ranges that they tolerate. Goldfish (European Carp) for example, have quite a high pH range they tolerate, with the Optimum range being between 7.4 and 7.8.
Dumping of industrial pollutants and runoff from mining activities can lower pH (making water more acidic). Low pH can weaken shells and exoskeletons and kill macroinvertebrates. More information about pH levels and freshwater ecosystems is available at extension.usu.edu/waterquality/whats-in-your-water/ph |
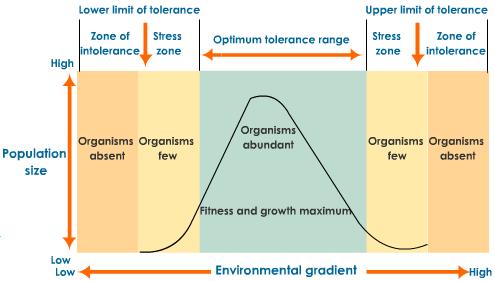
Looking at this graph, any abiotic factor can be placed on the x-axis "Environmental Gradient". If we consider this abiotic factor to be pH, then low would be pH = 1 and pH = 14 would be high.
http://image.wistatutor.com/content/organisms-environment/environmental-gradient.jpeg
Phosphate
Phosphates are often found in water that is polluted by detergents such as laundry detergent and run off from agricultural land that uses fertilisers.
Task 4
Safety: Wear Gloves and Safety Glasses
Disposal: Flush down sink with plenty of water
Materials
Analysing Results
A result greater than 0.05mg/L is considered unhealthy for a wetland
A result lower than 0.05mg/L is considered healthy for a wetland
Phosphates are often found in water that is polluted by detergents such as laundry detergent and run off from agricultural land that uses fertilisers.
Task 4
Safety: Wear Gloves and Safety Glasses
Disposal: Flush down sink with plenty of water
Materials
- PO4-1
- PO4-2 – Contains sulfuric acid 30-52%
- 1 x Black measuring spoon
- 1 x Plastic Beaker for sampling
- 2 round glass tubes with screw caps
- 1 comparator block
- 1 colour comparison disc (phosphate)
- Place comparator block into the position provided in the box
- Insert the colour comparator disc into the slot at the base
- Open both round glass tubes, rinse several times with the water sample and fill up to the mark with the sample
- Add 1 level black measuring spoon of PO4-1 to the right glass tube, close and mix
- Add 15 drops of PO4-2 to the right glass tube, close and mix
- Turn the colour disc until both colours match by reading from above
- Read the number on the front side of the comparator
Analysing Results
A result greater than 0.05mg/L is considered unhealthy for a wetland
A result lower than 0.05mg/L is considered healthy for a wetland
Ammonium
Nitrogen is a key nutrient in freshwater systems. This means that increased concentrations of nitrogen provide increased opportunity for growth of algae and other plants. Nitrogen can act as a limiting nutrient if phosphorus concentrations are high. However, if both nitrogen and phosphorus concentrations are high, they can contribute to algal blooms and infestations of aquatic macrophytes.
Task 5: Testing Ammonium
Safety: Wear Gloves and Safety Glasses
Disposal: Flush down sink with plenty of water
Materials
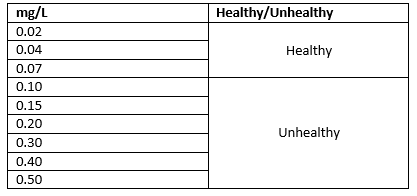
An Ammonium level below 0.10mg/L is considered healthy in the wetlands. Higher than 0.10mg/L is considered unhealthy.
Nitrogen is a key nutrient in freshwater systems. This means that increased concentrations of nitrogen provide increased opportunity for growth of algae and other plants. Nitrogen can act as a limiting nutrient if phosphorus concentrations are high. However, if both nitrogen and phosphorus concentrations are high, they can contribute to algal blooms and infestations of aquatic macrophytes.
Task 5: Testing Ammonium
Safety: Wear Gloves and Safety Glasses
Disposal: Flush down sink with plenty of water
Materials
- NH4-1
- NH4-2
- Black measuring spoon
- Plastic beaker
- Round glass tubes with screw caps
- Comparator block
- Colour comparison disc Ammonium
- Place comparator block into the position provided in the box
- Insert the colour comparator disc into the slot at the base
- Open both round glass tubes, rinse several times with the water sample and fill up to the mark with the sample
- Add 10 drops of NH4-1 to the right glass tube, close and mix
- Add 1 level black measuring spoon to the right glass tube, close and mix
- Wait 15 minutes
- Turn the colour disc until both colours match by reading from above
- Read the number on the front side of the comparator
An Ammonium level below 0.10mg/L is considered healthy in the wetlands. Higher than 0.10mg/L is considered unhealthy.
