Brainstorm
 Source: http://oame.on.ca/main/files/thinklit/PlaceMat2.pdf
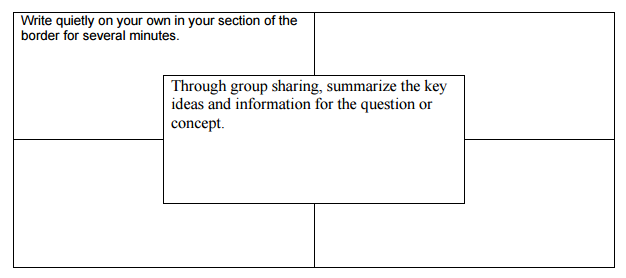
* On your own, write your response on post it notes to the question: What is data?
Place your post it notes on the placemat provided.
* Together as a group of 4, take turns to discuss your answers and put a tick beside all of the things you agree discuss data in this topic.
In the centre of the placemat, write down a response that you have all agreed on together.
* As a class, take turns for each group to share their common response and come up with one meaning together.
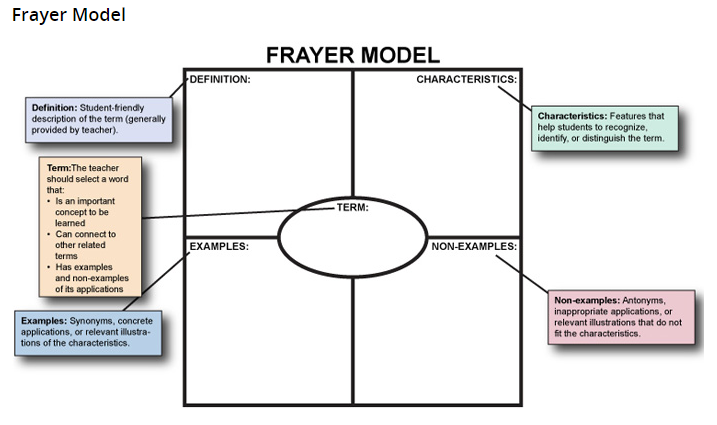
In your workbook, draw a Frayer Model with the Term: Data in the centre
Write the class agreed definition in the top left hand box.
Place your post it notes on the placemat provided.
* Together as a group of 4, take turns to discuss your answers and put a tick beside all of the things you agree discuss data in this topic.
In the centre of the placemat, write down a response that you have all agreed on together.
* As a class, take turns for each group to share their common response and come up with one meaning together.
In your workbook, draw a Frayer Model with the Term: Data in the centre
Write the class agreed definition in the top left hand box.
Source: https://iris.peabody.vanderbilt.edu/module/sec-rdng/cresource/q2/p07/sec_rdng_07_link_frayer/#content
Characteristics of data
What are the characteristics of data?
How do we know that we are looking at data?
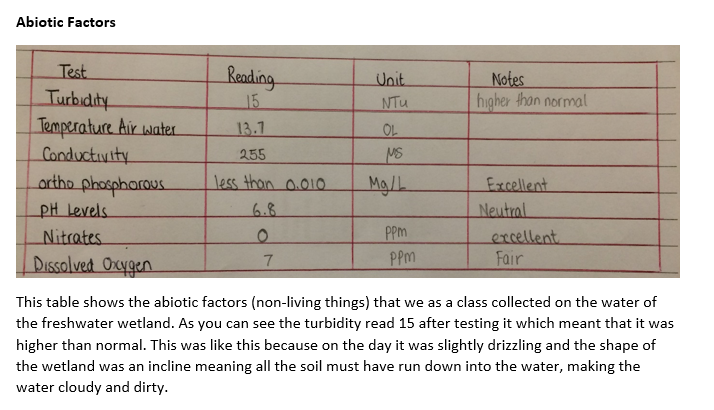
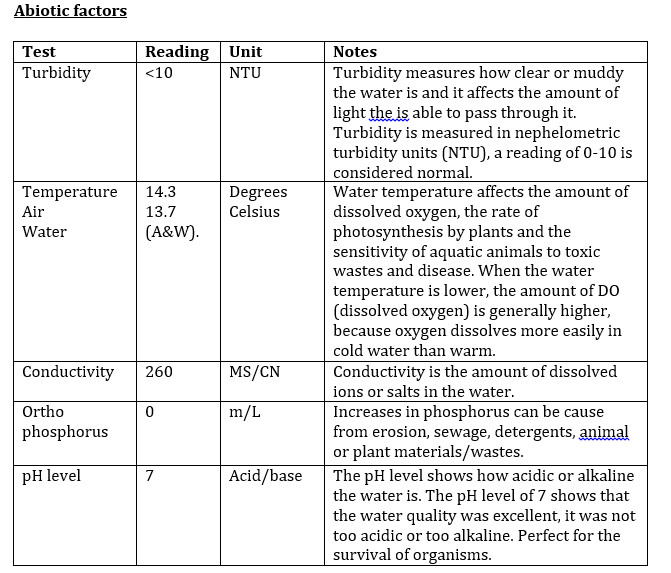
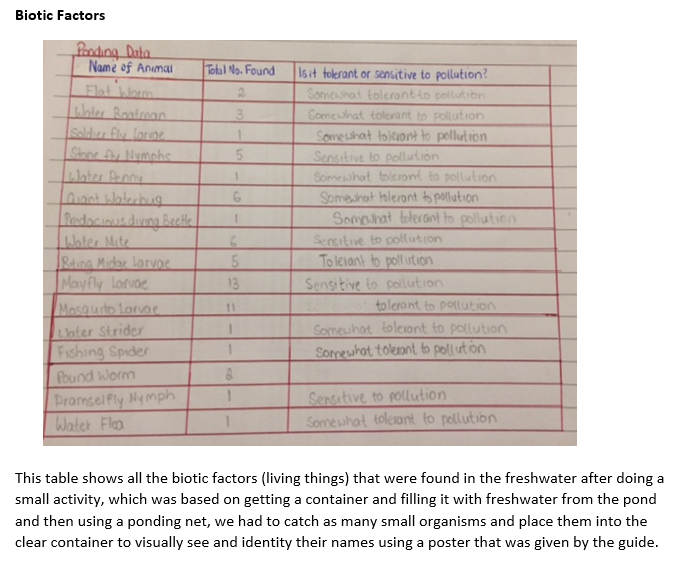
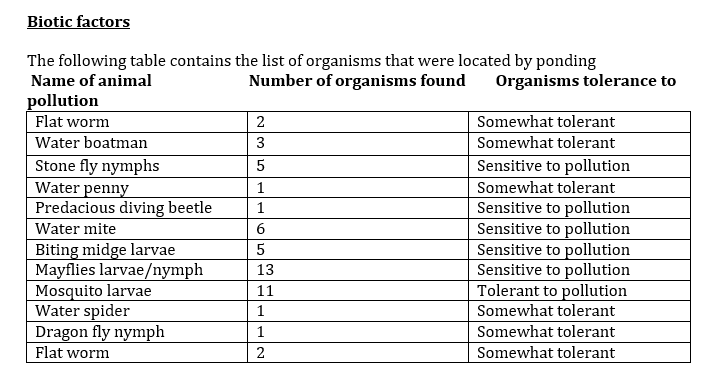
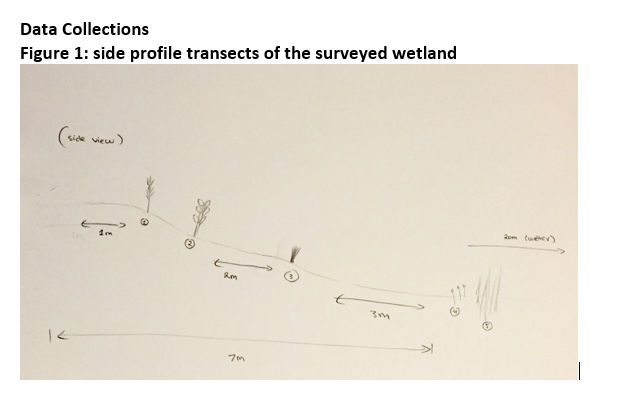
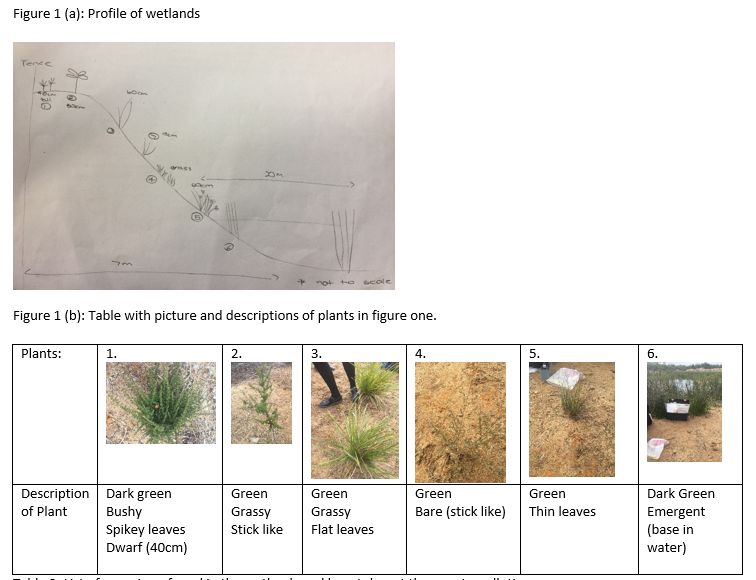
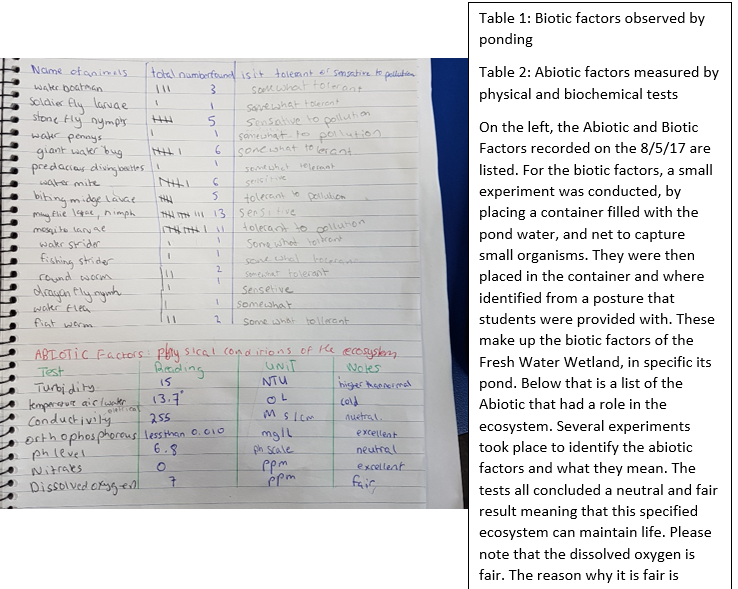
Look at the pictures below of data students have collected at Field Investigations previously. What features does their data have?
Write the Characteristics of data in the Characteristics section of your Frayer Model.
How do we know that we are looking at data?
Look at the pictures below of data students have collected at Field Investigations previously. What features does their data have?
Write the Characteristics of data in the Characteristics section of your Frayer Model.


Data are results that make meaning for the reader
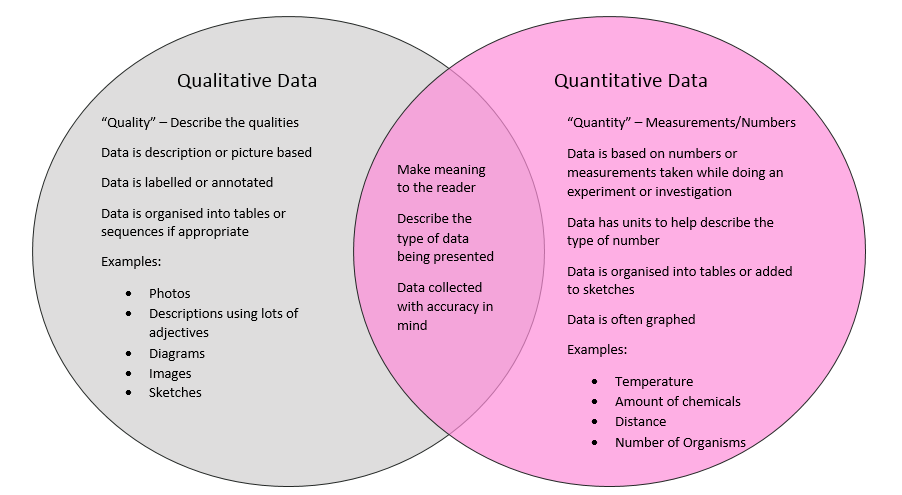
There are two main categories of data: Descriptive or Qualitative Data and Numerical or Quantitative Data
In the examples section of your Frayer Model, divide it into two columns Qualitative and Quantitative.
In the examples section of your Frayer Model, divide it into two columns Qualitative and Quantitative.
- Write examples of each data type in this section, using the Venn Diagram above.
- Add other examples you come up with yourself or as a class.
- Use pictures to show examples of these types of data.
What else can the word data mean?
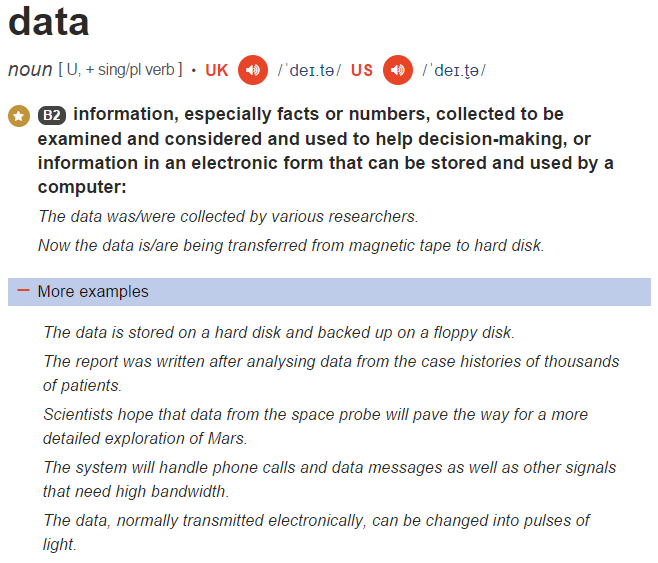
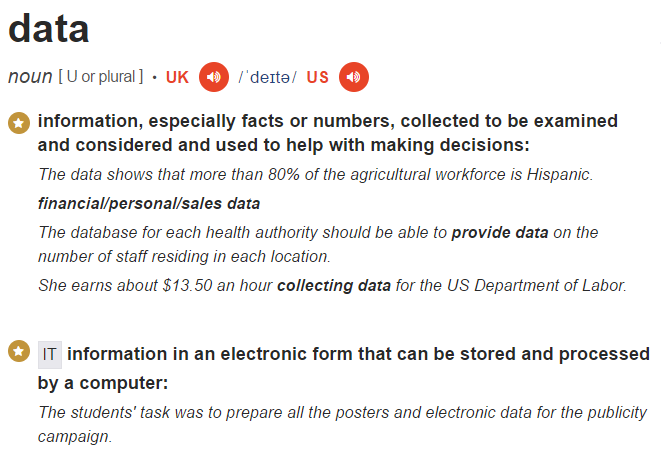
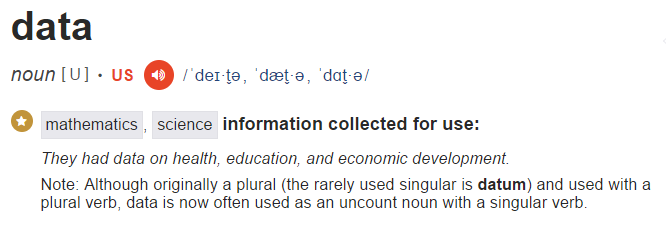
There are other meanings for the term data that, while similar to the meaning we use in Maths and Science, could confuse us.
Consider these dictionary definitions for the term 'data'. Which ones do not apply to the meaning in Maths and Science?
Write these other definitions in the Non-examples section of your Frayer Model. Can you add any other uses of the word data into this section?
Consider these dictionary definitions for the term 'data'. Which ones do not apply to the meaning in Maths and Science?
Write these other definitions in the Non-examples section of your Frayer Model. Can you add any other uses of the word data into this section?
First hand and Second hand data
First hand data is the data you collect yourself during an investigation or experiment. Second hand data is the data collected by someone else and includes books, websites and reports that you may use as part of your research.
Both types of data are equally important. Imagine going to the wetlands to see the ducks, but not finding any ducks there on that day. Does that mean that ducks never live in this wetland? What if a book or the Melbourne Water brochure says that ducks live at this wetland? Who is right?
We often compare first and second hand data to support our explanations. We may say that "although we didn't see any ducks on the day we visited, ducks live at the wetlands as they are recorded as a species to be observed at the wetlands in the Melbourne Water brochure."
Using data to support our explanations
The purpose of data is to give evidence to support our explanations. We cannot say that they temperature rose over several days, without referring to the temperature data we collected.
In the example above of the ducks, we could have just said "ducks live at the wetlands" or "we did not see ducks", but we would only have told part of the story in our explanation.
Structure of an explanationA written, an explanation needs a title or heading. This will tell the reader what the text is about.
The introductory paragraph introduces the topic with a general statement. This paragraph explains what is covered in the text.
The body paragraphs will use facts to help answer the question stated in the introduction. The body is also called the explanation sequence. This is the most important part of an explanation and should be well organised and easy to understand. These body paragraphs will use the data you collected yourself (first hand data) and the data you collected from your research (second hand data). We need to make sure we say where our data came from in our explanation.
Each body paragraph will have a similar structure with a Topic Sentence (your point), Evidence (your data and/or second hand data that supports your point), and Elaboration (which explains how the data supports your point) and a link to the overall topic (e.g. how this data gives us information about the health of the wetland).
The conclusion ends the explanation. This paragraph is often used to re-state the problem and solution.
Explanations often have visual representations. This can include photos, drawings, diagrams and charts. Visual representations often make the text easier to understand. Visual imagery must be explained and referred to in your text to make a clear link to the point you are trying to make.
A glossary of terms might also be part of an explanation. Glossaries are usually used for scientific or technical explanations.
The bibliography is a list of resources, like books, magazines and websites, which were used to help write the information report.
Preparing your own explanationBefore writing your own explanation it is important to establish the question (or problem) that you want to answer. It is also important to research your subject to help you better understand it. Make sure you organise your information so that your explanation is easy to understand.
When writing an explanation it is important to leave out your personal thoughts and opinions. Explanations use facts to provide an answer to a problem or question. If there are a lot of technical terms it might be a good idea to put them into a glossary.
Always check your text for correct spelling, grammar and punctuation.
